Tip: Start typing in the input box for immediate search results.Can't find what you're looking for? Submit a support request here.
Context Menu Overview
Introduction
With the release of StressCheck v12.0, users can right-click and hold the mouse cursor anywhere on the Model View to display a context-sensitive menu. Depending on the location and context of the right-mouse click, a list of appropriate options will appear to provide the user with productive shortcuts and handy commands affecting the display of model objects and/or results data. To cancel the display of the context menu, simply right-click again anywhere in the Model View.
Note: the right-click context menu will display only if the user holds down the right mouse button on the Model View for at least 150 milliseconds. If the right mouse button is clicked on the Model View for less time, and a context menu is not already displayed, the deselect objects command will execute. The minimum time to display the right-click context menu can be modified by navigating to the Options pane, setting a new value for “Context Menu” and clicking OK. To disable the display of the right-click context menu, uncheck “Context Menu” and then click OK.
Right-Clicking in Model View White Space
If the user right-clicks in the Model View “white space” (away from any visible objects or the plot legend), the following context menu will appear (Figure 1):
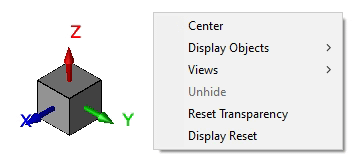
While this context menu is displayed, the user may use the left mouse button to select any of the listed options:
- Center: center the current model display in the Model View
- Display Objects: filter the display of object types in the Model View. Note that this option is the same as the “Display Objects…” dropdown in the Display Objects toolbar (insert link here to that documentation).
- All Objects: all object types will be displayed.
- Pts/Curves/Surfaces: only point, curve and surface objects will be displayed.
- Surfaces Only: only surface objects will be displayed.
- Elements/Nodes: only element and node objects will be displayed.
- Elements Only: only element objects will be displayed.
- Curves Only: only curve objects will be displayed.
- Points Only: only point objects will be displayed
- Nodes Only: only node objects will be displayed
- Views: select from a list of pre-defined and custom saved views.
- Isometric: rotate the model into isometric view.
- Previous: revert the model to the previous view configuration.
- Front (Z+): rotate the model such that the Z+ axis points out of the Model View.
- Back (Z-): rotate the model such that the Z- axis points out of the Model View.
- Top (Y+): rotate the model such that the Y+ axis points out of the Model View.
- Bottom (Y-): rotate the model such that the Y- axis points out of the Model View.
- Left (X+): rotate the model such that the X+ axis points out of the Model View.
- Right (X-): rotate the model such that the X- axis points out of the Model View.
- Default: set the model to the Default saved view configuration.
- Quicksave: save the current view configuration to “View_#”, where “#” is an (automatically incremented) integer. Views saved using this option will also be listed on the “Restore Saved View (D)” dropdown.
- Unhide: this option will be available if the user has hidden any objects from the display. Note that only hidden object types will be enabled.
- All Objects: unhide all hidden objects.
- Surfaces: unhide all hidden surface objects.
- Elements: unhide all hidden element objects.
- Curves: unhide all hidden curve objects.
- Legend: unhide the legend (if hidden).
- Triad Axis: unhide the global triad axis (if hidden).
- Reset Transparency: reset the transparency of all objects to the defaults.
- Display Reset: redraw the display of the current view configuration.
Right-Clicking on/near Visible Objects
If the user right-clicks on/near a visible body object (sheet or solid), element object, or curve object (wireframe or surface boundary), a context menu will appear with a list of options dependent on the selected object type.
Body and Curve Context Menus
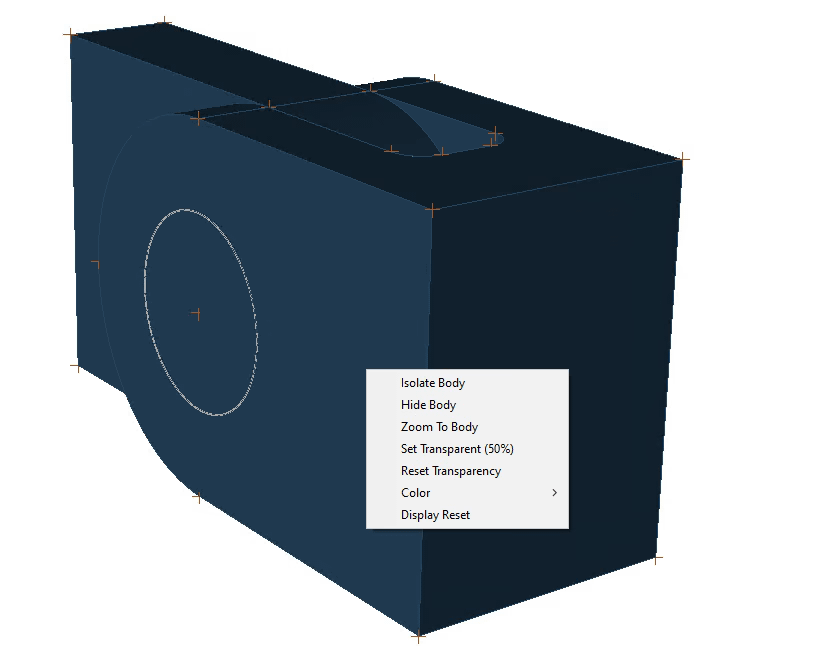
Right-clicking on/near a visible body object will display the following context menu (Figure 2):
Similarly, right-clicking on/near a visible curve object will display the following context menu (Figure 3):
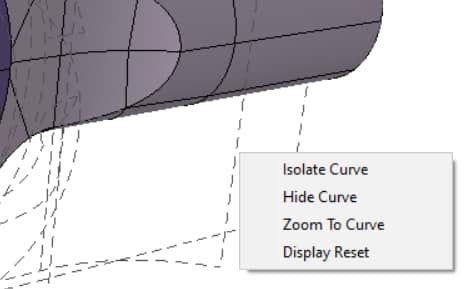
Selecting the context menu options listed in Figures 2 and 3 will result in:
- Isolate Body/Curve: display only the selected Body/Curve in the Model View.
- Hide Body/Curve: hide the selected body/curve from the Model View.
- Zoom To Body/Curve: zoom to the selected body/curve such that its display fills the Model View.
- Set Transparent (50%): set the transparency of the selected body to be 50%.
- Once the object is transparent, right-clicking on the same object will allow the user to uncheck this option to display the object at 0% transparency.
- Reset Transparency: reset the transparency of all bodies to the defaults.
- Color: set the color of the selected body to one of the available solid color definitions.
- Display Reset: redraw the display of the current view configuration.
If multiple bodies/curves are selected before right-clicking, the context menu options will reflect this status. For example, if the user holds down the left mouse button and marquee selects a group of visible bodies, the following context menu will appear on right-click (Figure 4):
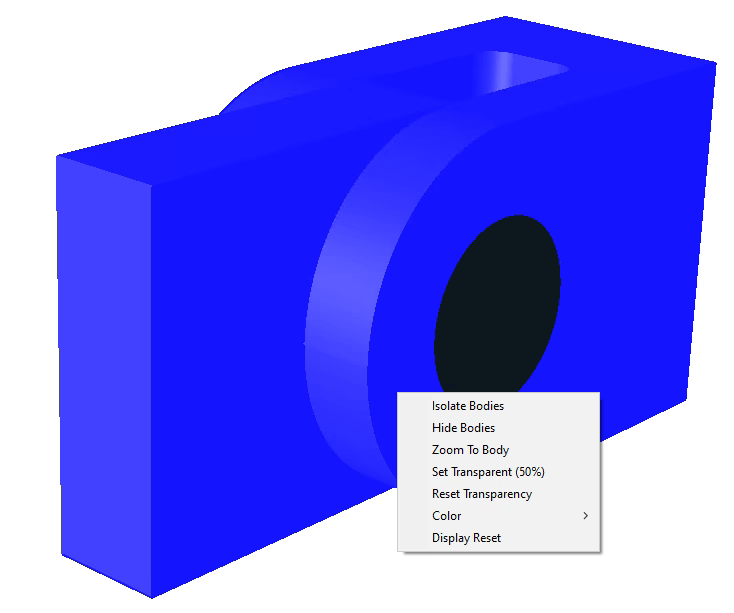
Clicking any of the context menu options will perform the command on the currently selected body/curve objects.
Element Context Menu
Right-clicking on/near a visible element object will display the following context menu (Figure 5):
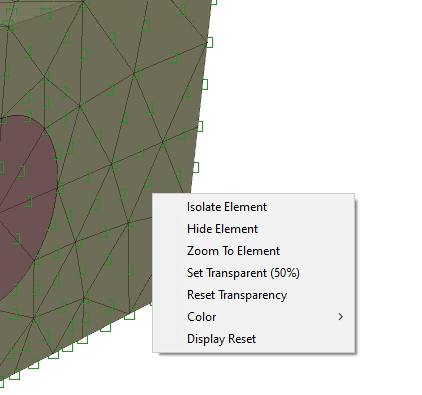
While this context menu is displayed, the user may use the left mouse button to select any of the listed options. For the case of an element object:
- Isolate Element: display only the selected element in the Model View.
- Hide Element: hide the selected element from the Model View.
- Zoom To Element: zoom to the selected element such that its display fills the Model View.
- Set Transparent (50%): set the transparency of the selected element to be 50%.
- Once the object is transparent, right-clicking on the same object will allow the user to uncheck this option to display the object at 0% transparency.
- Reset Transparency: reset the transparency of all elements to the defaults.
- Color: set the color of the selected element to one of the available color definitions.
- Same as Solid: set the color of the element to the same color as the solid body to which the element is associated.
- Reset: set the color of the selected element back to the material assignment color (if assigned), or to the default element color.
- Note: replacing an existing material assignment for, or adding a new material assignment to, the an element will overwrite that element’s current color assignment.
- Display Reset: redraw the display of the current view configuration.
If multiple elements are selected before right-clicking, the context menu options will reflect this status. For example, if the user holds down the left mouse button and marquee selects a group of visible elements, the following context menu will appear on right-click (Figure 6):
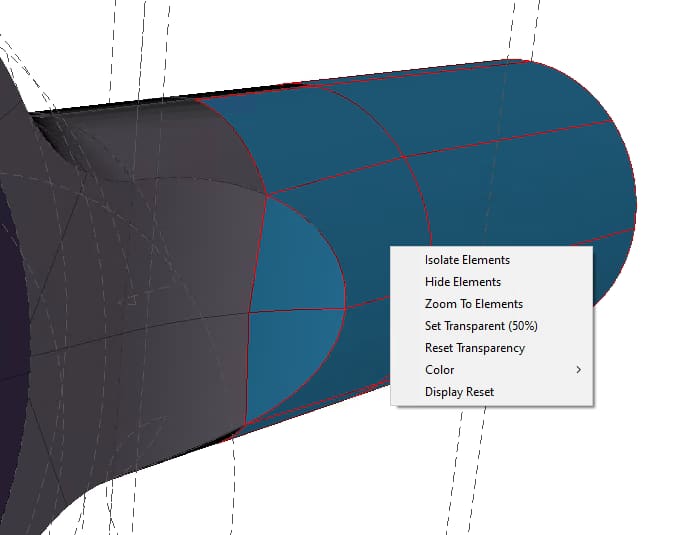
Clicking any of the context menu options will perform the command on the currently selected element objects.
Right-Clicking on/near Plot Legend
After generating a plot (via the Plot tab in the Results pane), the user may right click on/near the plot legend to produce an applicable context menu. There are two distinct areas of the plot legend, each producing different context menu options: the legend header and the fringe attributes.
Legend Header Context Menu
Right-clicking on/near the legend header area, which contains the solution ID, run number, DOF solved, and name of the function currently being plotted, will display the following context menu (Figure 7):
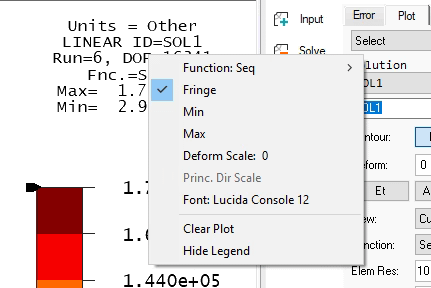
While this context menu is displayed, the user may use the left mouse button to select any of the listed options. For the case of the legend header area of the plot legend:
- Function: (Current Function): displays the name of the current plotted function.
- To set a new engineering function to be plotted for the current solution ID and associated run number, left click the function name on the list of available functions and the plot will be automatically updated with the new function.
- For a list of all available engineering functions, refer to (insert link here).
- Fringe: enables/disables the Contour: Fringe toggle.
- Min: draw a marker to locate the minimum value of the current plotted function.
- Max: draw a marker to locate the maximum value of the current plotted function.
- Deform Scale (Current Scale Factor): displays the current deformed shape scale factor.
- Left-clicking on this option will allow the user to enter a new value for the deformed shape scale factor, move the slider to scale the deformed shape scale factor up or down, or automatically set the deformed shape scale factor by toggling on the Auto button.
- If the deformed shape scale factor is manually input, hit Enter on the keyboard to rescale the plot of the deformed shape.
- If the Auto toggle is enabled, or the slider is moved, the plot of the deformed shape will be automatically rescaled.
- Princ. Dir Scale: if a principal stress (S1, S2, S3) function or principal strain (E1, E2, E3) function is plotted, displays the current scale factor used to draw the principal direction arrows (Default = 0). If a principal stress/strain function is not selected, this option will not be available.
- Left-clicking on this option will allow the user to enter a new value for the principal direction arrow scale factor, move the slider to scale the principal direction arrow scale factor up or down, or automatically set the principal direction arrow scale factor by toggling the Auto button.
- If the principal direction arrow scale factor is manually input, hit Enter on the keyboard to rescale the principal direction arrows.
- If the Auto toggle is enabled, or the slider is moved, the principal direction arrows will be automatically rescaled.
- Font (Current Plot Information Font): set the font used to display the plot information text (Default = Lucinda Console 12).
- Left clicking on this option will display the Font pane, where a new font name, type and size can be set.
- Clicking OK will update the font used to display the plot information text.
- Clear Plot: clears the display of the currently plotted data.
- Hide Legend: temporarily hide the legend. Note: to unhide the legend, right click on the Model View white space and use Unhide > Legend.
Fringe Attributes Context Menu
Right-clicking on/near the fringe attributes area of the plot legend, which will only be available if the user toggles on the Fringe button on the Plot tab, will display the following context menu (Figure 8):
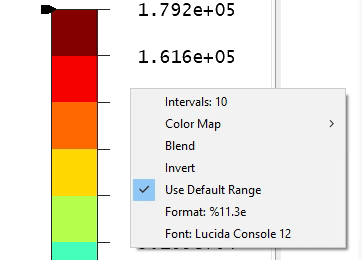
While this context menu is displayed, the user may use the left mouse button to select any of the listed options. For the case of the fringe attributes area of the plot legend:
- Intervals: (Number of Intervals): number of intervals used for fringe attributes (Default = 10).
- Left-clicking on this option will allow the user to enter a new value for the number of intervals. Hit Enter to apply the new value.
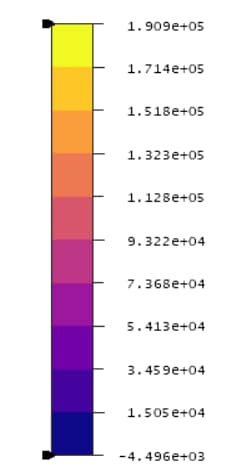
- Color Map: set the color map used for fringe attributes (Default=Classic).
- To change the color map, select one of the available options from the Color Map list.
- For example, the “Plasma” color map has the following appearance (Figure 9):
- Blend: enable color blending for the current fringe plot.
- Invert: invert the color map for the current fringe plot.
- Use Default Range: enable/disable if StressCheck should compute the fringe attribute range minimum and maximum values.
- To change the fringe attribute range maximum value, the user may right-click at/near the black arrow pointing to the maximum value on the color map, enter a new value in the “Max:” input, and hit Enter:
- To change the fringe attribute range minimum value, the user may right-click at/near the black arrow pointing to the minimum value on the color map, enter a new value in the “Min:” input, and hit Enter:
- Dragging the black arrows up/down the color map may also be used to set the fringe attribute range minimum/maximum values, respectively.
- To change the fringe attribute range maximum value, the user may right-click at/near the black arrow pointing to the maximum value on the color map, enter a new value in the “Max:” input, and hit Enter:
- Format (Current Display Format): set the display format for the fringe attribute values (Default = %11.3e).
- Left-clicking on this option will allow the user to enter a new value for the display format (in C language conventions). Hit Enter to apply the new value.
- For more information on setting the display format, refer to (insert link here).
- Font (Current Fringe Attributes Font): set the font used to display the fringe attribute text (Default = Lucida Console 12).
- Left clicking on this option will display the Font pane, where a new font name, type and size can be set.
- Clicking OK will update the font used to display the fringe attribute text.
 Serving the Numerical Simulation community since 1989


