

Verifying the accuracy of FEA solutions is straightforward when employing the following Key Quality Checks.
In a recent ESRD webinar, we asked a simple but powerful question: if you routinely perform Numerical Simulation via finite element analysis (FEA), how do you verify the accuracy of your engineering simulations? During this webinar, we reviewed ‘The Four Key Quality Checks’ that should be performed for any detailed stress analysis as part of the solution verification process:
- Global Error: how fast is the estimated relative error in the energy norm reduced as the degrees of freedom (DOF) are increased? And, is the associated convergence rate indicative of a smooth solution?
- Deformed Shape: based on the boundary conditions and material properties, does the overall model deformation at a reasonable scale make sense? Are there any unreasonable displacements and/or rotations?
- Stress Fringes Continuity: are the unaveraged, unblended stress fringes smooth or are there noticeable “jumps” across element boundaries? Note: stress averaging should ALWAYS be off when performing detailed stress analysis. Significant stress jumps across element boundaries is an indication that the error of approximation is still high.
- Peak Stress Convergence: is the peak (most tensile or compressive) stress in your region of interest converging to a limit as the DOF are increased? OR is the peak stress diverging?
When the stress gradients are also of interest, there is an additional Key Quality Check that should be performed:
- Stress Gradient Overlays: when stress distributions are extracted across or through a feature containing the peak stress, are these gradients relatively unchanged with increasing DOF? Or are the stress distribution overlays dissimilar in shape?
In this S.A.F.E.R. Simulation blog, we’ll explore each of the above Key Quality Checks as well as additional best practices for verifying the accuracy of FEA solutions. To help us drive the conversation in a practical manner, we selected a widely available and well understood benchmark problem to model, solve and perform each Key Quality Check using ESRD’s flagship FEA software, StressCheck Professional.
Note: the following Key Quality Checks for FEA Solution Verification focus on results processing for linear and nonlinear detailed stress analyses applications. Webinars containing solution verification best practices have been previously presented for fracture mechanics applications, global-local analysis (co-hosted by Altair), and fastened connection and bolted joint analysis.
Benchmark Problem: Tension Bar of Circular Cross Section with Semi-Circular Groove
Benchmark problem for Key Quality Checks for FEA Solution Verification.
The benchmark problem for the following discussion focuses on accurately computing a very common stress concentration factor, the classical solution(s) of which may be found in myriad engineering handbook publications and used often by many practicing structural engineers: tension bar of circular cross section with a semi-circular groove.
Since the available literature supports numerous classical solutions, we will limit our coverage to three (3) of the most popular classical stress concentration factor approximation sources: Peterson, Shigley and Roark.
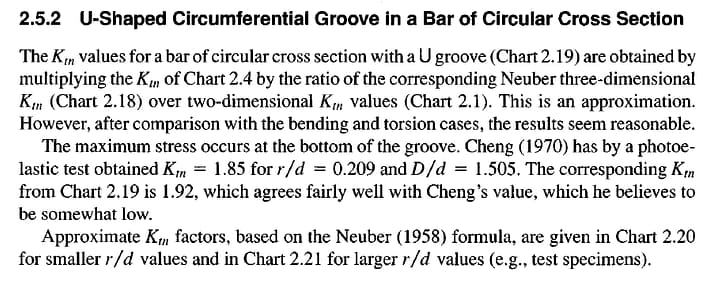
Classical Source #1: ‘Peterson’s Stress Concentration Factors’ (Pilkey)
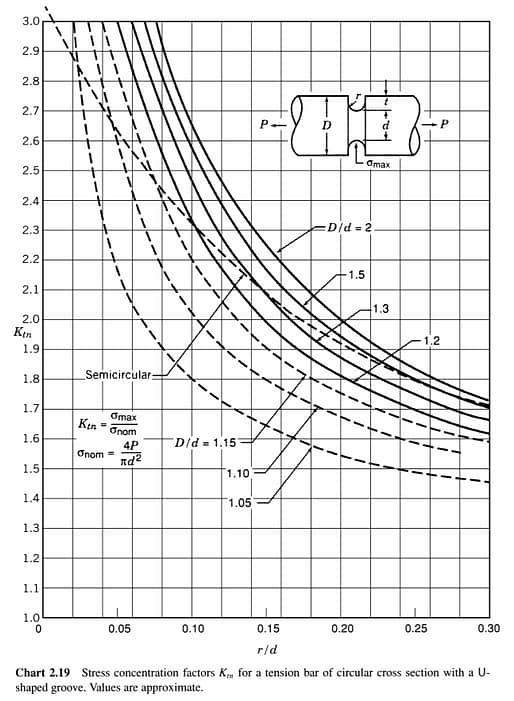
Our first classical source comes from Section 2.5.2 and Chart 2.19 (‘Stress concentration factors Ktn for a tension bar of circular cross section with a U-shaped groove’) in ‘Peterson’s Stress Concentration Factors’, 2nd Edition, by Walter D. Pilkey:
Courtesy ‘Stress Concentration Factors’, 2nd Edition (Pilkey).
Courtesy ‘Stress Concentration Factors’, 2nd Edition (Pilkey).
The curve marked ‘Semicircular’ will be used for the classical stress concentration factor approximation.
Note: as is documented in Section 2.5.2 above, Chart 2.19 is computed from the Neuber 3D case Ktn curve (Chart 2.18, see below) for a nominal Poisson’s ratio of 0.3:
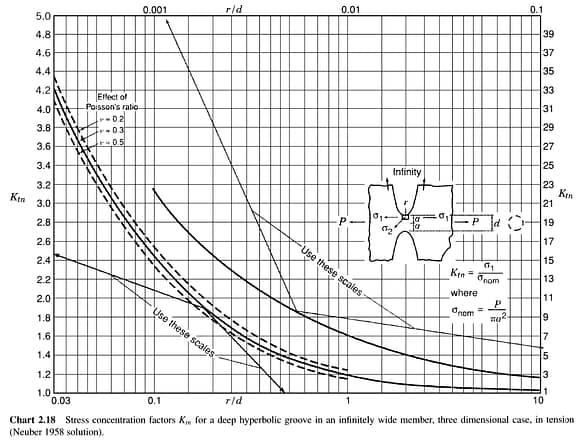
Courtesy ‘Stress Concentration Factors’, 2nd Edition (Pilkey).
Pilkey notes in Section 1.4 (‘Stress Concentration as a Three-Dimensional Problem’) that the Poisson’s ratio will have an effect on the Ktn for cases such as the above.
Classical Source #2: ‘Shigley’s Mechanical Engineering Design’ (Budnyas & Nisbett)
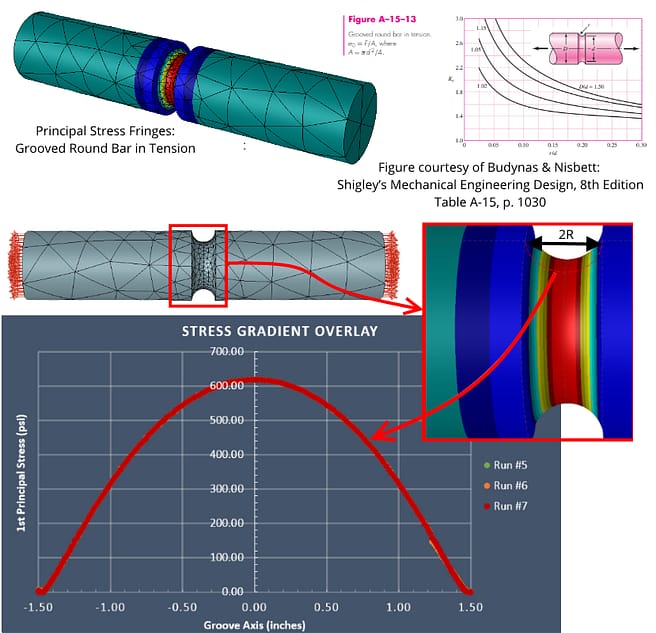
Our second classical source comes from Figure A-15-13, Table A-15, in ‘Shigley’s Mechanical Engineering Design’, 9th edition, by Richard G. Budnyas & J. Keith Nisbett:
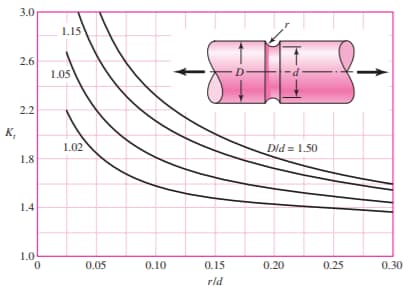
Courtesy ‘Shigley’s Mechanical Engineering Design’, 9th edition (Budnyas & Nisbett).
Classical Source #3: ‘Roark’s Formulas for Stress and Strain’ (Young & Budynas)
Our third source comes from the equation in Table 17.1, ’15. U-notch in a circular shaft’, ‘Roark’s Formulas for Stress and Strain’, 7th Edition, by Warren C. Young and Richard D. Budynas:
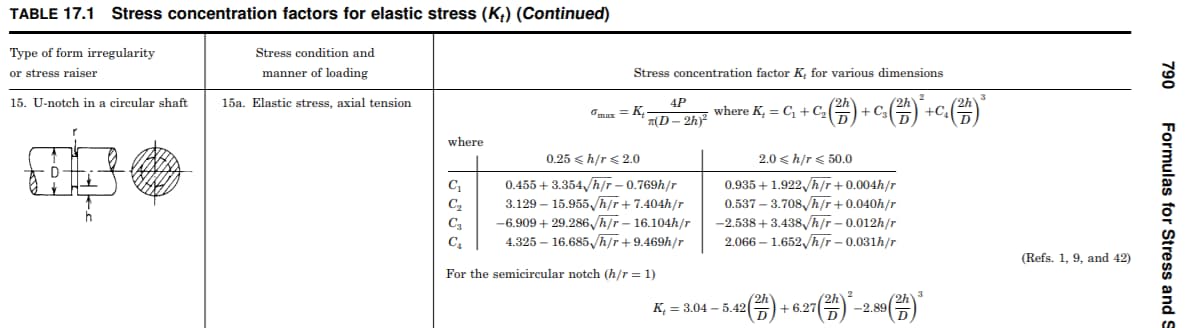
Courtesy Roark’s ‘Formulas for Stress and Strain’, 7th Edition (Young & Budynas).
We will use the equation for the semi-circular notch (h/r = 1) for the classical stress concentration factor approximation.
Classical Stress Concentration Factor Comparison:
For this benchmark case study, the dimensions and axial tension force were defined as following (in US Customary units):
- D = 9″
- d = 6″
- h = 1.5″
- r = 1.5″
- P = 10,000 lbf
- σnom = 4*P/π/d2 = 354 psi
- r/d = 0.25
- D/d = 1.5
- h/r = 1.0
These values result in the following classical solutions for the stress concentration factor:
| Classical Source | Ktn | σmax = Ktn*σnom |
| Peterson | 1.78 | 630.12 psi |
| Shigley | 1.69 | 598.26 psi |
| Roark | 1.82 | 644.28 psi |
The above classical solutions are noted by the authors as approximations of the stress concentration factor, given the configuration of geometric and axial loading parameter values; the exact solution can be obtained by solving the 3D elasticity problem. An approximation to the solution of the elasticity problem can be obtained using the finite element method (e.g. via StressCheck Professional or another FEA implementation).
A reasonable goal of our benchmark case study is to determine which (if any) of the classical solutions best approximates this particular configuration.
Modeling Process: CAD + Automesh + BC’s + Material Properties
The solid geometry for the benchmark case study was constructed in StressCheck Professional using 3D solid modeling techniques, an automesh of 3665 curved tetrahedral elements was generated, and boundary conditions (axial loads, rigid body constraints) were applied:
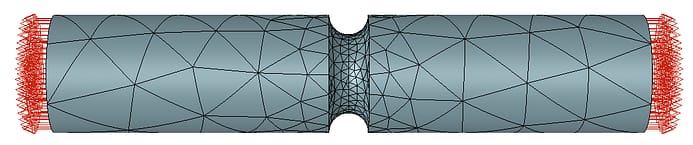
Curved Tetrahedral Automesh (courtesy StressCheck Professional)
The linear elastic material properties selected for the benchmark case study are representative of a 2014-T6 aluminum extrusion (i.e. E = 10.9 Msi, v = 0.397).
Solution Process: Linear P-extension + Fixed Mesh
The model was analyzed in StressCheck Professional’s Linear solver via an hierarchic p-extension process, in which the orders of all elements on the fixed mesh were uniformly increased from 2nd order (p=2) to 8th order (p=8) for a total of seven (7) runs.
Note: before executing the solution, the mesh was converted to geometric (blended) mapping, which ensured the optimal representation of the geometric boundaries. This conversion was required for the solution order to exceed p=5, as by default StressCheck Professional’s tetrahedral elements are curved using 2nd order functions (Isopar).
Since StressCheck Professional automatically stores all completed runs of increasing DOF for results processing, we can determine the minimum DOF for which the benchmark case study was well approximated for each Key Quality Check.
Note: it is not necessary to always increase the order of all elements to 8th order, unless the mesh is a) generated manually and is a minimum mesh of high-aspect ratio elements, or b) a solution of exceedingly low discretization error in the data of interest is the goal (our reason). Many times a sufficiently refined mesh at a lower order (p<6) will achieve an acceptable discretization error for most practical engineering applications.
Results Extraction: Do We Pass Each Key Quality Check?
After the solution process completed, the estimated relative error in the energy norm (EREEN) was automatically reported as 0.01%, indicating no significant discretization errors but telling us very little about our data of interest, the stress concentration factor.
Then, how do we determine if we have an accurate enough FEA solution to approximate the stress concentration factor for the benchmark case study? Let’s go through each Key Quality Check to determine if our discretization is sufficient.
Key Quality Check #1: Global Error
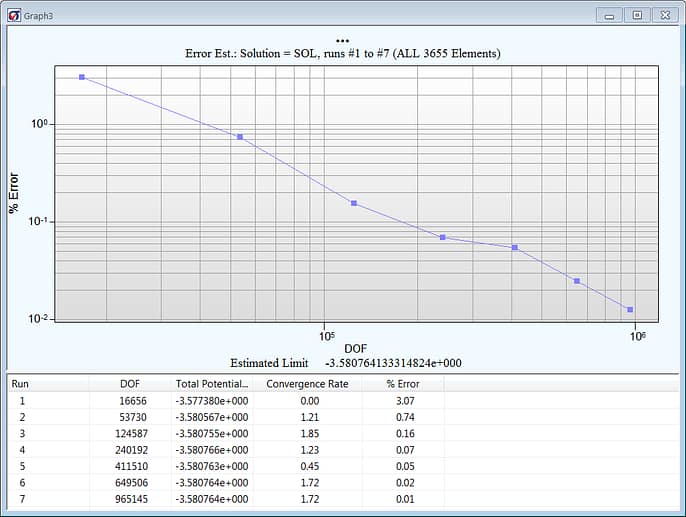
Key Quality Check #1: Global Error (courtesy StressCheck Professional)
Studying how the global error (% Error column), as represented by EREEN, decreases with increasing DOF is our first ‘Key Quality Check’. This value is a measure of how well we are approximating the exact solution of the 3D elasticity problem in energy norm.
Additionally, a Convergence Rate of >1.0 is also a good indicator of the overall smoothness of the solution. Note: in problems with mathematical singularities, such as the simulation of cracks in fracture mechanics applications, the convergence rate is typically <1.0.
VERDICT: Pass
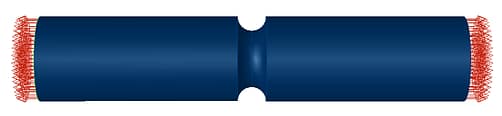
Key Quality Check #2: Deformed Shape
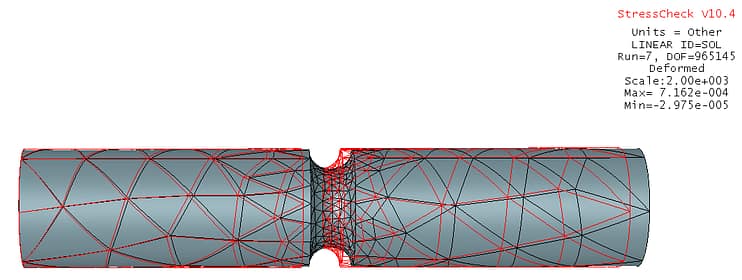
Key Quality Check #2: Deformed Shape (courtesy StressCheck Professional)
Since the benchmark case study was loaded axially under self-equilibrating loads of P=10,000 lbf, rigid body constraints were applied to three nodes at the leftmost side to cancel the six rigid body modes in 3D elasticity.
The deformed shape for the highest DOF run indicates the model is behaving as expected at a 2,000:1 deformed scale (red outlines are the undeformed configuration).
VERDICT: Pass
Key Quality Check #3: Stress Fringes Continuity
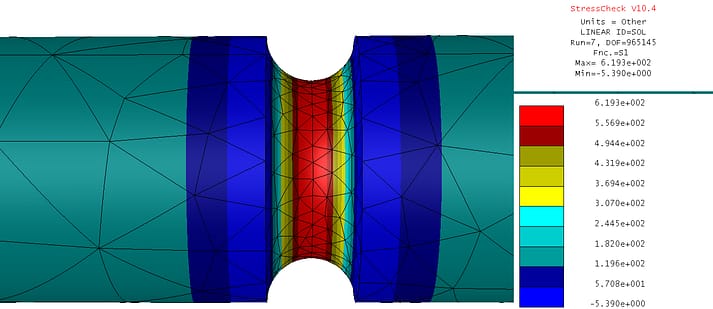
Key Quality Check #3: Stress Fringes Continuity (courtesy StressCheck Professional)
When assessing the stress fringes for quality, it is important to ensure that there are no significant “jumps” across element boundaries (edges/faces) in regions where the stresses are expected to be smooth, continuous and unperturbed. This assessment requires that the stresses be plotted without any averaging or blending features enabled.
The 1st principal stress (S1) fringe continuity for the highest DOF run is quite smooth across element boundaries, with no significant “jumps” detected in the region of interest (root of the notch). The maximum 1st principal stress value (S1max) is computed as 619.3 psi.
However, we will need to verify that this value has converged to a limit (e.g. independent of DOF) before it is compared with the benchmark case study’s theoretical Ktn and σmax.
VERDICT: Pass
Key Quality Check #4: Peak Stress Convergence
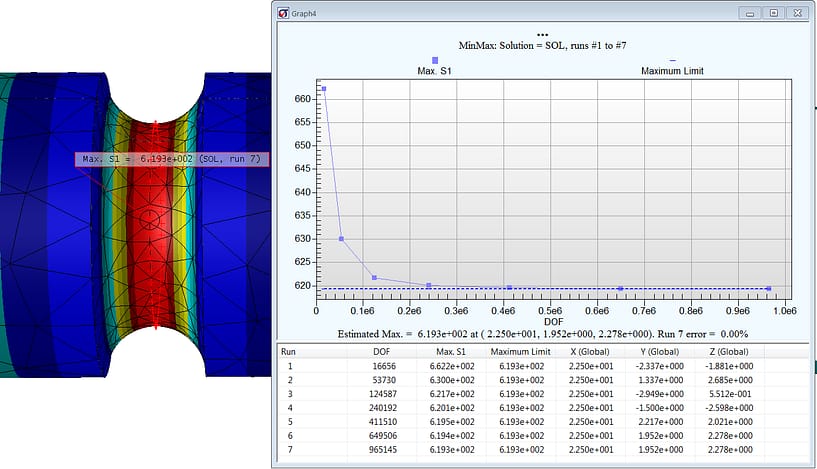
Key Quality Check #4: Peak Stress Convergence (courtesy StressCheck Professional)
For this benchmark case study, our data of interest was the peak stress at the root of the circumferential groove. Since StressCheck Professional automatically keeps all solutions for ‘deep dive’ results processing, it is very simple and easy to ‘check the stress’.
Selecting the StressCheck model’s curve which encircles the root of the groove, an extraction of maximum 1st principal stress (S1max) vs. each run of increasing DOF was performed. Even though we have a fairly refined mesh in the groove, note the large differences between the first three runs (p=2 to 4) and the final four runs (p=5 to 8). For this reason, it is simply not enough to have a “good mesh” or smooth stress fringes that pass the “eyeball norm”; the peak stress values must be rigorously proven to be independent of mesh and DOF.
It can be observed from the table that convergence in S1max was achieved by the 4th or 5th run, with a converged value of S1max = 619.3 psi. Here is a summary of how the classical stress concentration factor approximations Ktn rate for this particular configuration:
| Classical Source | Ktn | σmax = Ktn*σnom | Converged S1max | % Relative Difference: |
| Peterson | 1.78 | 630.12 psi | 619.3 psi | 1.75 |
| Shigley | 1.69 | 598.26 psi | 619.3 psi | -3.39 |
| Roark | 1.82 | 644.28 psi | 619.3 psi | 4.03 |
% Relative Difference = 100*(σmax – S1max)/S1max
It appears that Peterson’s classical stress concentration factor approximation is most appropriate, with a relative difference of 1.75% when compared to the estimated exact solution from the numerical simulation.
Note: the S1max convergence table confirms that it was not necessary to continue increasing the DOF by p-extension past the 5th run (p=6 in this particular case); we could have stopped the p-extension process once the error in the S1max was sufficiently small for our purposes.
VERDICT: Pass
A Note on the Poisson’s Ratio Effect
Recalling the derivation of the Peterson Ktn, the value use in the benchmark case study assumed a v=0.3 for its approximation, while a v=0.397 as was used in StressCheck Professional. This highlights the importance of understanding the derivation and limitations of classical solutions.
If we “eyeball” Chart 2.18 for r/d = 0.25 and a v~0.4, we get a Ktn of ~1.78 (vs. Ktn~1.81 for v=0.3). We then multiply the Peterson Ktn by 1.78/1.81 to get an ‘adjusted’ Peterson Ktn ~1.75 for v=0.397. This results in a σmax = 619.67, a difference of 0.06%.
Learn More (Video)
That being said, it is always up to the engineer and management to determine an acceptable classical solution error in practical engineering applications.
Key Quality Check #5: Stress Gradient Overlays
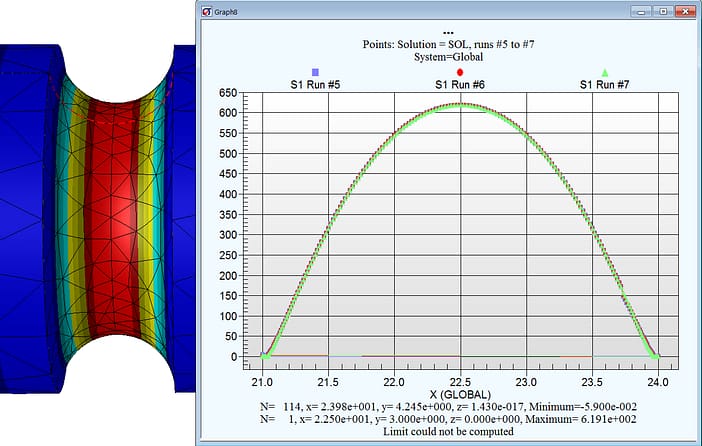
Key Quality Check #5: Stress Gradient Overlays (courtesy StressCheck Professional)
As an additional Key Quality Check, we should ensure that the stresses nearby the location of peak stress are also well-represented and do not change much with increasing DOF. In StressCheck Professional we can dynamically extract the stresses across or through any feature, for any resolution and available solution, and overlay these stress gradients on the same chart for an assessment of quality.
The stress gradient extraction was performed across the groove for the final three runs (p=6 to 8), and the automatic stress gradient overlay showed that there was practically no difference between the point-wise values. Again, this proves that the 5th run (p=6) was sufficient for representing both the peak stress and the groove stress gradient.
Note: as for the stress fringe continuity check (Key Quality Check #3), it is important to perform this extraction without averaging features enabled.
VERDICT: Pass
In Summary…

Example of the democratization of classical engineering handbook methods via FEA-based digital engineering applications.
Solutions of typical structural details in 2D and 3D elasticity obtained by classical methods are approximations obtained using various techniques developed in the pre-computer age. This benchmark case study shows that in order to rank results obtained by classical methods, they have to be compared with the corresponding values obtained from the exact solution of the problem of elasticity. Alternatively, when the exact solution is not available, classical methods can be compared with the results from an approximate solution of the same problem of elasticity obtained by FEA.
It was also shown that strict solution verification procedures are required to provide evidence that the approximation error in the quantities of interests are much smaller than the difference observed among the results obtained by classical solutions, an essential technical requirement of Simulation Governance and any benchmarking-by-FEA process.
Finally, this example also highlights another important point: Classical engineering handbooks and design manuals are examples of democratization practiced in the pre-computer age. With the maturing of numerical simulation technology it is now possible to remove the manifold limitations of classical engineering solutions and provide parametric solutions for the problems engineers actually need to solve. This is the main goal of democratization.
 There is a fundamentally important prerequisite, however: The exceptionally rare talents of engineer-scientists who populated conventional handbooks have to be democratized, that is, digitally mapped into the world of modern-day analysis.
The time has come for democratization to be reinvented.


Leave a Reply
We appreciate your feedback!
You must be logged in to post a comment.